PaSiMap Sequence Similarity Analysis
PaSiMap analyses are performed via the calculations dialog, accessed by selecting Calculate→Calculate Tree, PCA or PaSiMap....
Like the PCA function in Jalview, PaSiMap analysis creates a spatial representation of how similar sequences are within a selected group, or all of the sequences in an alignment. However, instead of using similarities calculated from the current alignment, PaSiMap calculates a pairwise alignment for each pair of sequences, which can take some time. After the calculation finishes, a 3D viewer displays the set of sequences as points in 'similarity space', and similar sequences tend to lie near each other in the space.
Since similarities in the PaSiMap calculation are calculated from pairwise alignments of all pairs of input sequences, the maximum number sequences that can be used to calculate a PaSiMap is limited to 20000. Jalview will provide an estimate of how long the calculation will take, and a 'Cancel' button so the calculation can be stopped if desired.
About PaSiMap
The PaSiMap technique has been shown to be an effective way of visualising patterns of similarity amongst closely related sequences (e.g. repeats, such as Titin). The approach takes as input a set of pairwise alignment scores, rather than from scores derived from a multiple alignment. These scores are used to compute q - which ranges between 0 (random) and 1 (high similarity). q reflects how good the alignment is as compared to an alignment of two random sequences with the same amino acid composition.
The matrix of q scores is then analysed with cc_analysis. This method produces a spatial projection of each sequence around an origin, where sequences sharing simialar features lie on similar projected angles to the origin, and their distance only affected by 'random variation'.

The PaSiMap Viewer
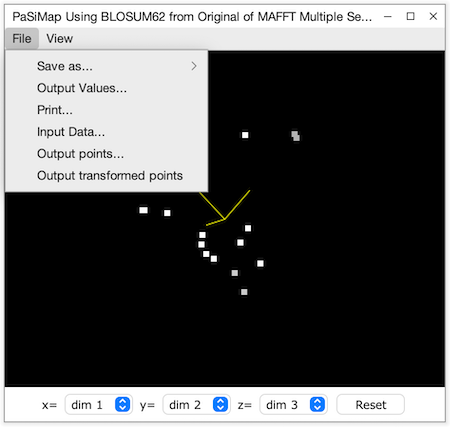
This is an interactive display of the sequences positioned within the similarity space, as points in a rotateable 3D scatterplot, based on the PCA viewer. The colour of each sequence point is the same as the sequence group colours, white if no colour has been defined for the sequence, and grey if the sequence is part of the currently selected group. The viewer also employs depth cueing, so points appear darker the farther away they are, and become brighter as they are rotated towards the front of the view.
The 3d view can be rotated by dragging the mouse with the left mouse button pressed, or with the arrow keys when SHIFT is pressed. The view can also be zoomed in and out with the up and down arrow keys (and the roll bar of the mouse if present). Labels will be shown for each sequence if the entry in the View menu is checked, and the plot background colour changed from the View→Background Colour.. dialog box. The File menu allows the view to be saved (File→Save submenu) as an EPS or PNG image or printed, and the original alignment data and matrix resulting from the PaSiMap analysis to be retrieved. The coordinates for the whole PaSiMap space, or just the current view may also be exported as CSV files for visualization in another program or further analysis.
Options for coordinates export allow them to be easily imported to R for further analysis. For a worked example, take a look at the STAR protocol paper (Morrell, submitted) and github repository for scripts.
Please see the original PaSiMap publication:
Su K,
Mayans O, Diederichs K and Fleming, JR (2020) "Pairwise sequence similarity
mapping with PaSiMap: Reclassification of immunoglobulin domains from titin as case study" in
Computational and Structural Biotechnology Journal 2022 5409-5419
https://doi.org/10.1016/j.csbj.2022.09.034